
Powered by Grail™
Log management and analytics
Make smarter, faster decisions when troubleshooting and measuring the health of your application environments – all while eliminating the costly overhead of ingestion and management.
Actionable insights for all your critical use cases
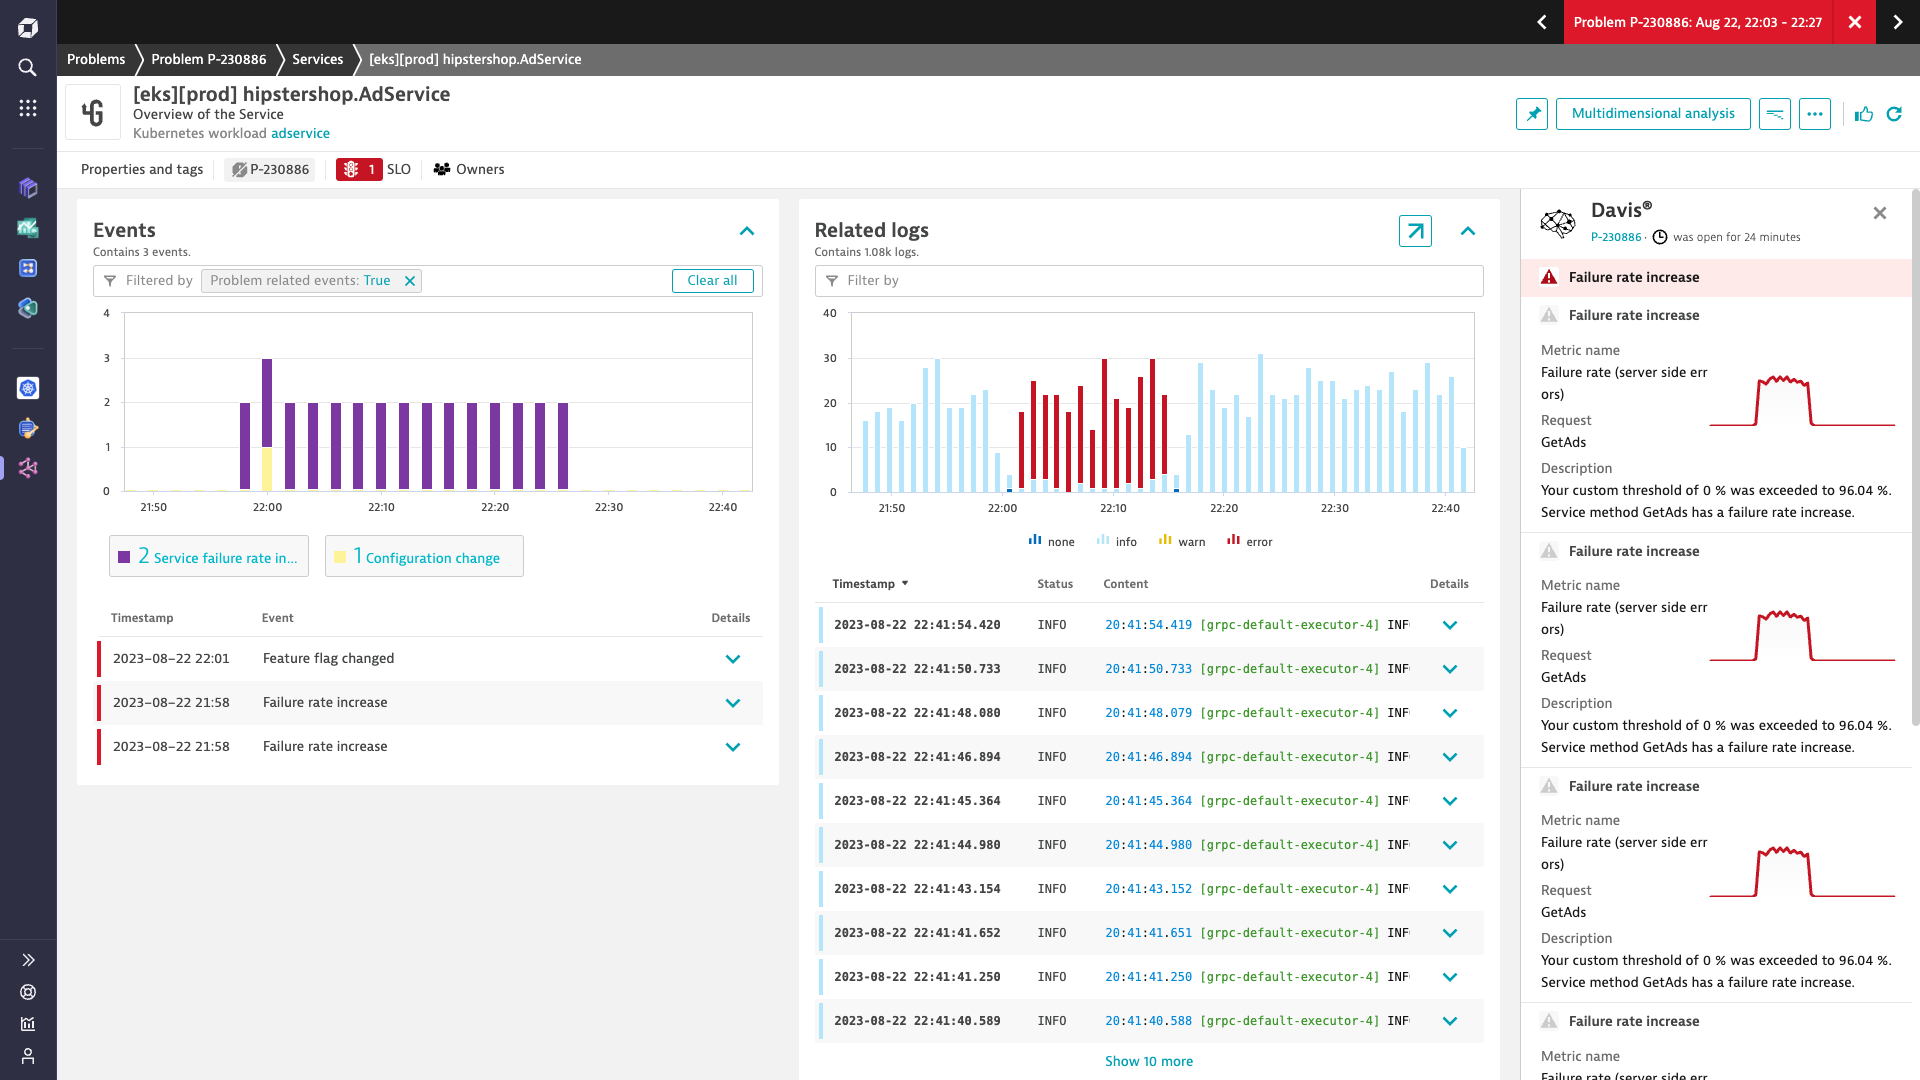
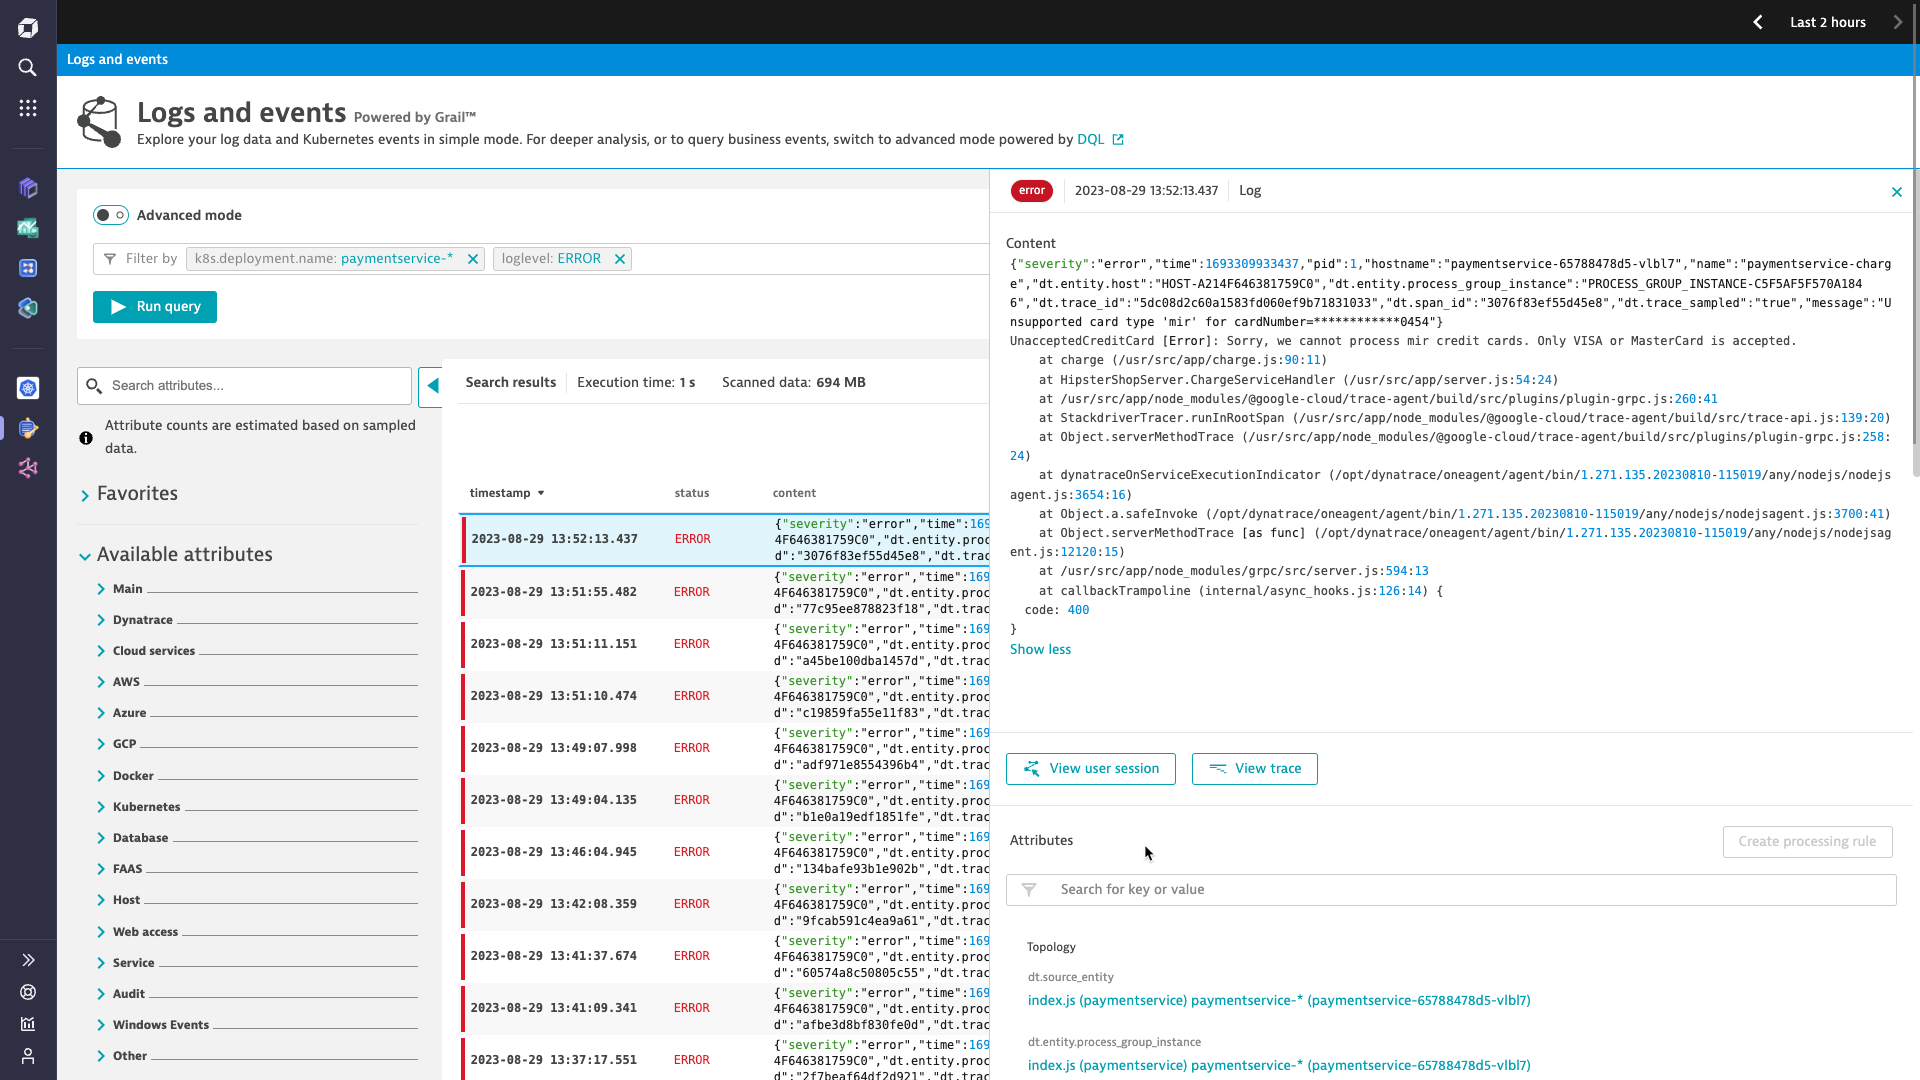
Troubleshooting
Automatically unify logs, traces, and metrics of events in real time
- Navigate from traces to logs to user sessions and vice versa to get full stack visibility
- Resolve issues faster with AI-powered root cause analysis
- Instantly understand business impact and dependencies
- Reduce MTTR by eliminating manual correlation between multiple tools, alerts, and data silos
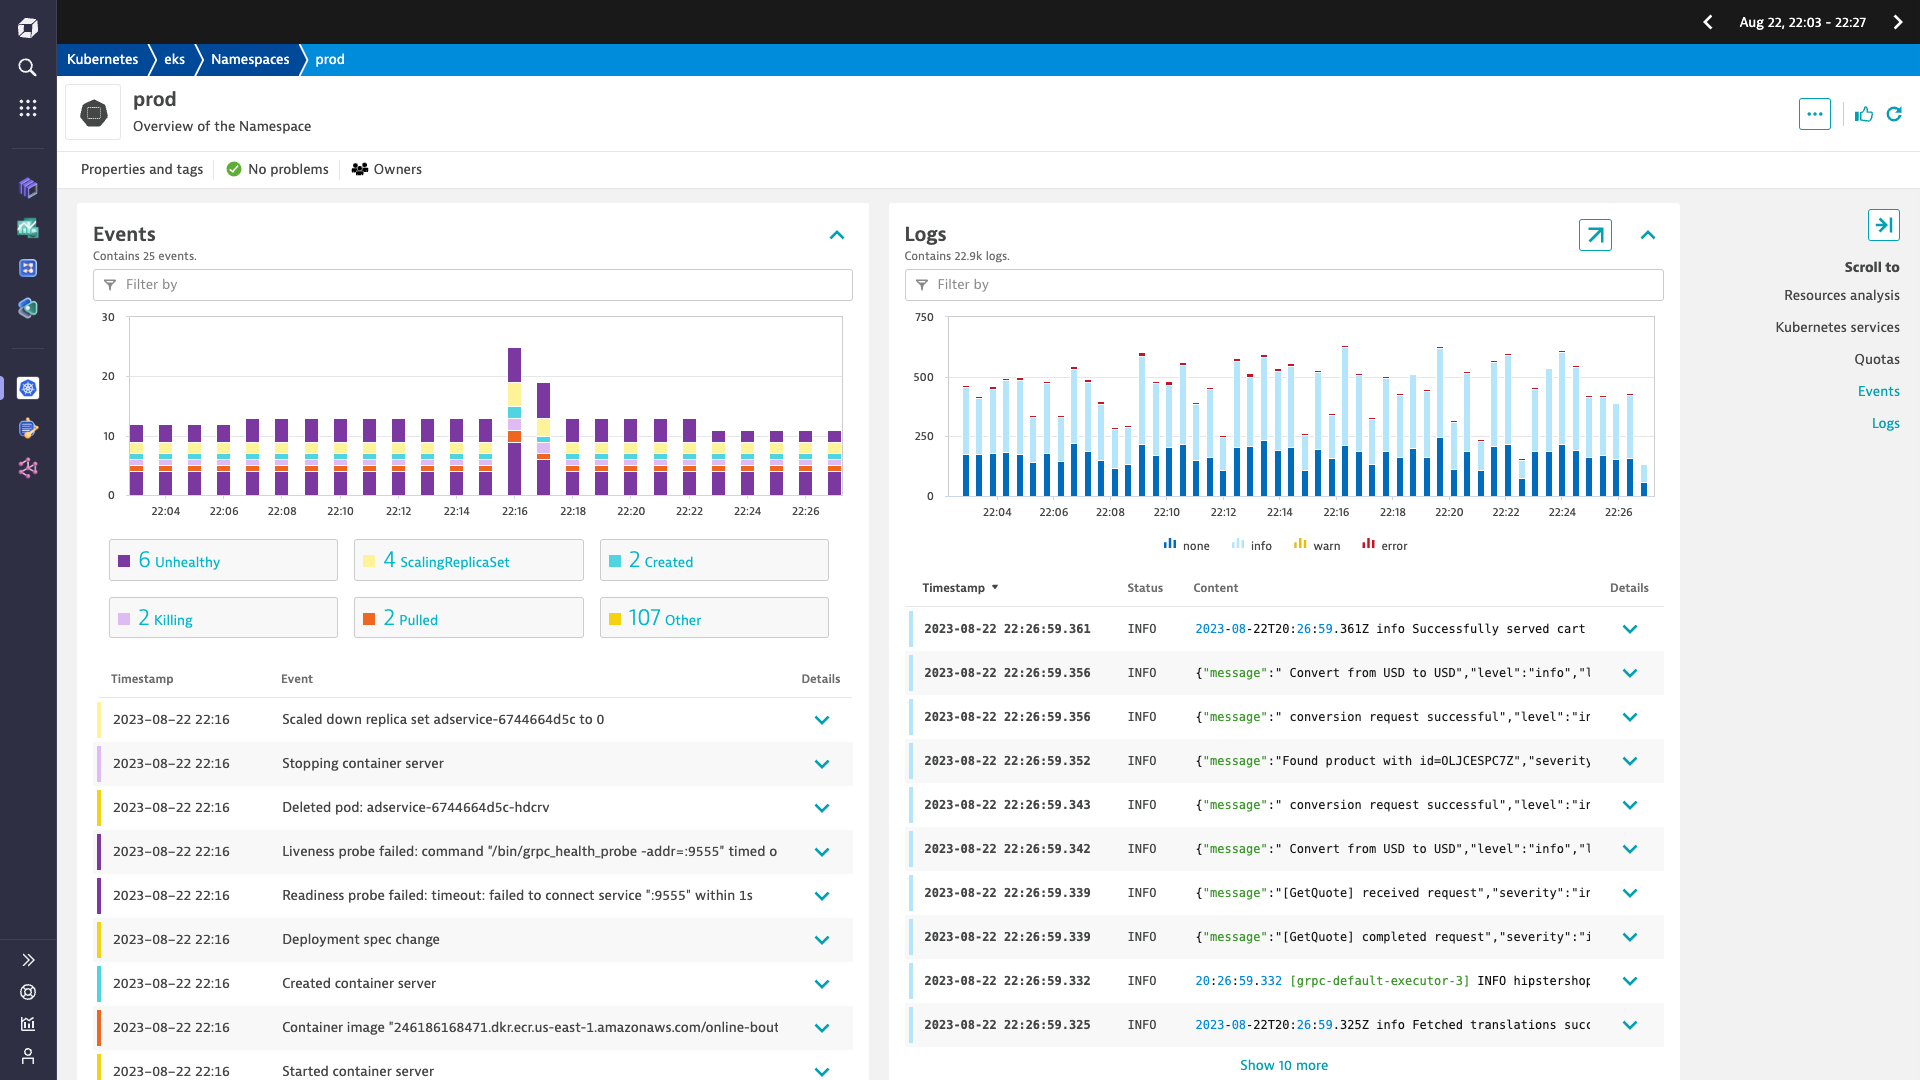
Kubernetes Observability
Easily monitor Kubernetes
- Improve cluster health and ensure performant applications across complex multi-cloud environments
- Store, analyze, and query cluster-level logs
- Filter by namespace, workload, node, pod, and container to simplify analysis
- Diagnose cluster health and troubleshoot application performance with AI-assisted analytics
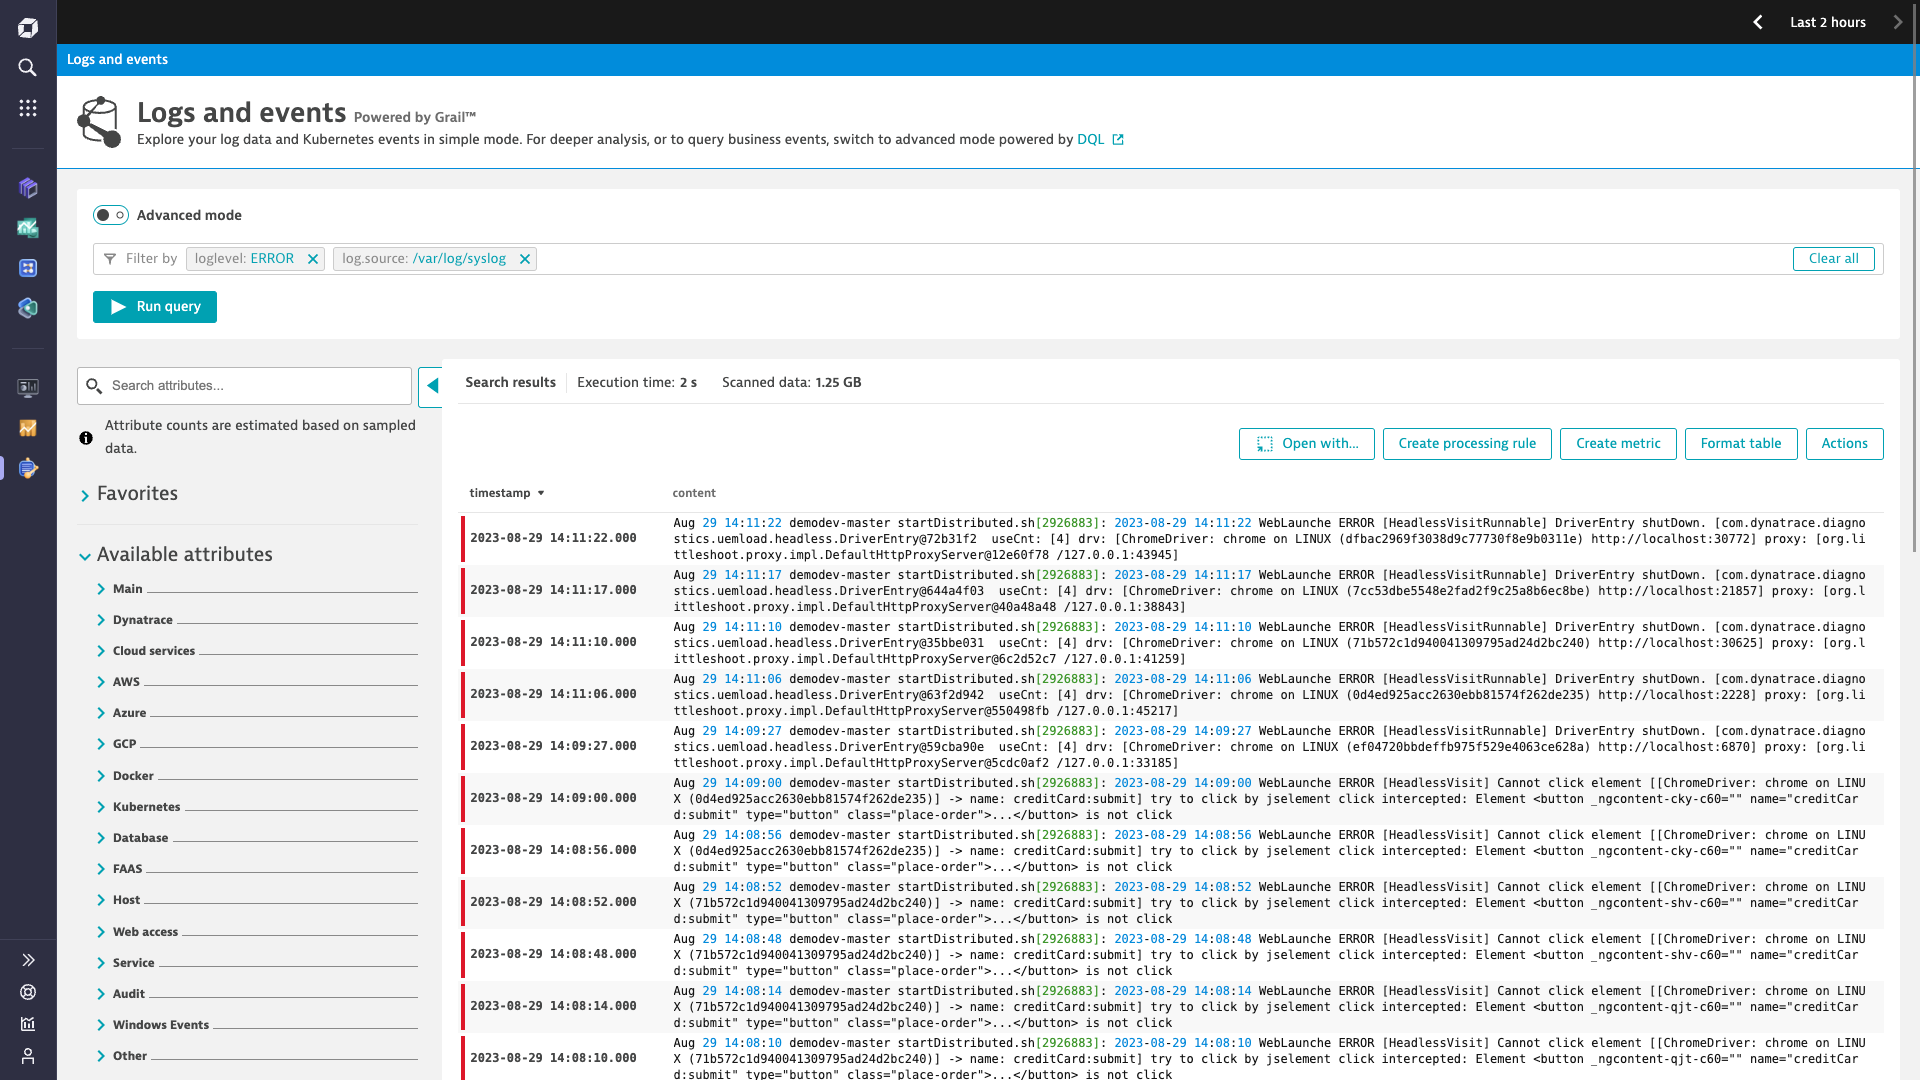
Log Processing
Optimize storage costs by extracting metrics from logs at ingest or on read
- Collect and parse log data in real-time without indexing
- Replace alert storms with AI-powered baselining and anomaly detection
- Filter, monitor, and transform log fields to meet policy and compliance requirements
Audit and Forensics
Resolve incidents faster
- Analyze and isolate attack patterns and impact
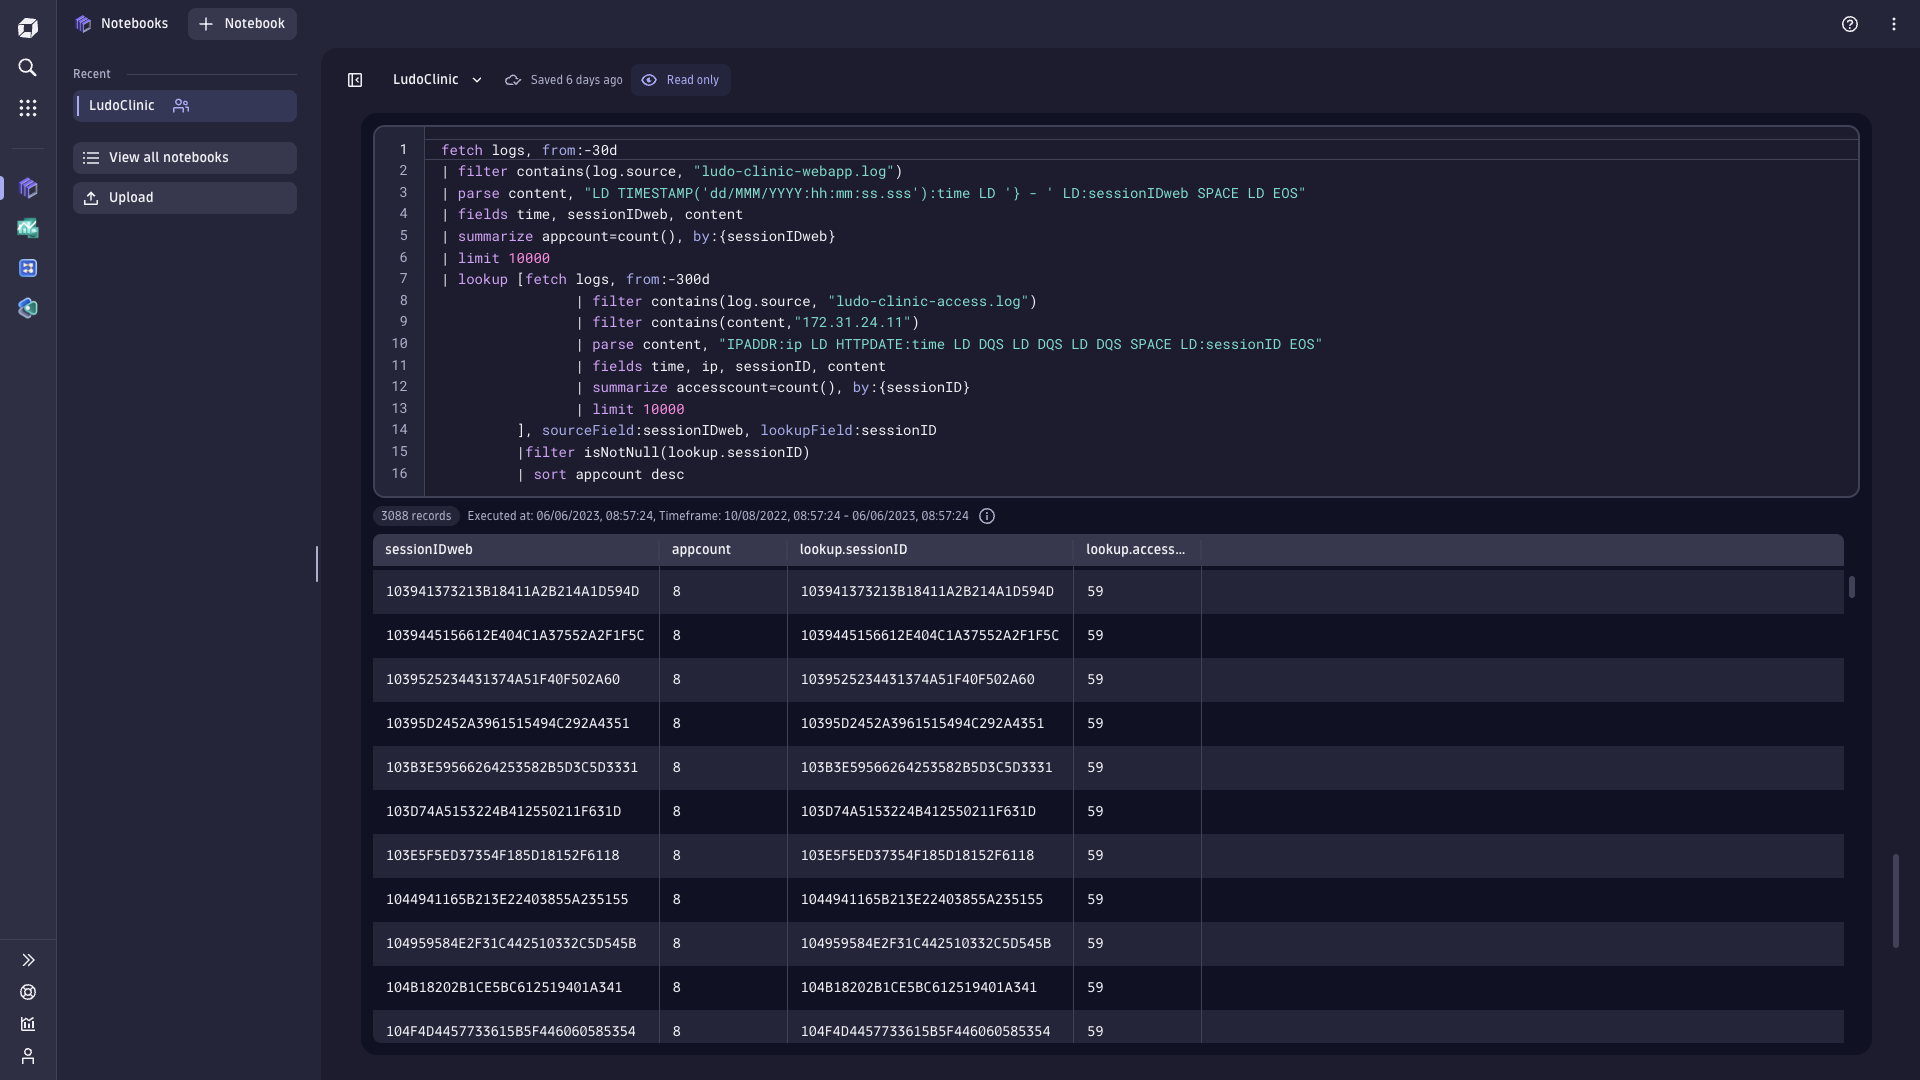
- Make any query, at any time, on any data set without reindexing with Dynatrace Query Language (DQL)
- Retain logs from days to years to meet your audit requirements
Do it all with the power of Grail
Dynatrace automatically and efficiently retains the context for petabytes of observability and security data in Grail, providing a single log management and analytics platform to bring your IT, security, and business teams together to meet your service level objectives.


See how BMO delivers better digital experiences with Dynatrace
Greater efficiency
Cut 60 hours of monthly log analytics toil per team
Faster innovation
Unlocked 40 hours of extra time for development
Higher availability
Issue analysis and resolution time slashed by 80%

Take on your biggest challenges

Silos
Event correlation and root cause analysis across teams and data pools

Scale
Teams and budgets cannot keep up the volume and variety of data

Speed
Tradeoffs between data cost, availability, and fidelity delay MTTR
Work faster and more effectively
Interactive tour
Get precise answers from unified log data in context
Start analyzing logs, metrics, and events in the context of traces, topology, and user sessions - with no more schemas or storage tiers to manage.


Start your 15-day free Dynatrace trial today!
Want to see what intelligent observability powered by AI and automation can do for you? Get a free trial of the Dynatrace platform now.
